Acta medica Lituanica ISSN 1392-0138 eISSN 2029-4174
2022. Online ahead of print DOI: https://doi.org/10.15388/Amed.2022.29.2.19
Magnetic Resonance Imaging Appearance
of Giant Intracerebral Tuberculoma:
A Retrospective Analysis
Deb Boruah*
Department of Radiology, All India Institute of Medical Sciences (AIIMS), Guwahati, 780101, Assam, India
Kalyan Sarma
Department of Radiology, All India Institute of Medical Sciences (AIIMS), Guwahati, 780101, Assam, India
Pallavi Gogoi
Department of Library and Information Science, DHSK College, Dibrugarh, 786001, Assam, India
Binoy Singh
Department of Neurosurgery, NEIGRIHMS, Shillong, Meghayala, 793018, India
Bidyut Gogoi
Department of Pathology, Assam Medical College, Dibrugarh, 786002, Assam, India
Karuna Hazarika
Department of Radiodiagnosis, Tezpur Medical College, Sonitpur, 784010, Assam, India
Barun K. Sharma
Department of Radiodiagnosis, Sikkim Manipal Institute of Medical Sciences, Gangtok, Sikkim,737103 India
Pranjal Phukan
Department of Radiodiagnosis, NEIGRIHMS, Shillong, Meghayala, 793018, India
Abstract. Background: Giant intracerebral tuberculomas are rare lesions but should be considered in the differential diagnosis of intracranial space-occupying lesion in an endemic region.
Objective: The purpose of this study is to analyze the clinical data and magnetic resonance imaging (MRI) findings of giant intracerebral tuberculomas to improve the diagnostic precision.
Material and Methods: The clinical and MRI findings of 22 patients of giant intracerebral tuberculoma were analyzed retrospectively. For the statistical analysis independent sample Student t-test was used.
Results: For 22 patients included in this sample the giant intracerebral tuberculoma was of size more than 2.5cm. The majority of the giant tuberculomas (19 patients (86.4%))was located in the supratentorial area.T2-weighted hypointense core of giant tuberculoma was observed in 12 patients (54.5%) and T1 hyperintensities were observed in peripheral (wall) of the giant tuberculoma in 14 patients (63.6%). The mean ADC value of the peripheral (wall) of the giant tuberculoma was 1.034± 0.466[SD] x 10-3mm2/s and the core was 0.994± 0.455[SD] x 10-3mm2/s with a statistically significant difference (p-value <0.0005) in between. MR spectroscopy showed raised lipid peak at 0.9 to 1.33 ppm in 10 patients (45.5%),raised lipid-lactate peak in 12 patients (54.5%),raised Choline/Cr ratio more than 1.2 in 14 patients(63.6%) and Choline/Cr ratio less than 1.2 in 5 patients (22.7%). Associated involvement of lung was observed in the 6patients (27.3%), cervical lymph node in 1 patient (4.5%) and spine in 1patient (4.5%).
Conclusions: MRI plays a vital role in distinguishing giant intracerebral tuberculomas from other intracranial space-occupying lesions, thereby allows the early institution of anti-tubercular treatment (ATT), decreased patient morbidity, mortality, and prevents unnecessary neurosurgical excision.
Keywords: Tuberculosis (TB), giant tuberculoma, diffusion-weighted imaging (DWI), MR spectroscopy.
Didžiosios intracerebrinės tuberkulomos atvaizdai taikant magnetinio rezonanso spektroskopiją: retrospektyvus tyrimas
Santrauka. Įvadas: Didžioji intracerebrinė tuberkuloma yra reta sveikatos problema, tačiau vertėtų atsižvelgti į jos galimybę atliekant diferencinę intrakranijinės erdvės diagnostiką endemini ame regione.
Tikslas: Šio tyrimo tikslas – ištirti didžiosios intracerebrinės tuberkulomos klininkinių tyrimų bei magnetinio rezonanso duomenis diagnozių tikslinimui.
Medžiagos ir metodai: Retrospektyviai ištirti 22 pacientų, kuriems buvo didžioji intracerebrinė tuberkuloma, klinikinių tyrimų ir magnetinio rezonanso duomenys. Statistinė analizė atlikta, naudojant nepriklausomos imties Stjudento t testą.
Rezultatai: Šiame tyrime dalyvavo 22 pacientai, kuriems buvo nustatyta didžioji intracerebrinė tuberkuloma (didesnė nei 2,5 cm). Daugeliu atvejų – 19 (86,4 %) pacientų – didžioji tuberkuloma buvo aptikta supratentorinėje galvos smegenų dalyje. T2 tipo hipointensyvi didžiosios tuberkulomos šerdis rasta 12 pacientų (54,5 %), o T1 tipo intensyvumas buvo matomas periferinėje (sienelės) didžiosios tuberkulomos dalyje 14 pacientų (63,6 %). Vidutinė didžiosios tuberkulomos sienelės ADC vertė (periferinė) buvo 1,034±0,466 [SD] x 10-3mm2/s, o šerdies vertė 0,994±0,455 [SD] x 10-3mm2/s; tarp jų buvo nustatytas reikšmingas statistinis skirtumas (p vertė <0,0005). Magnetinio rezonanso spektroskopija 10 pacientų (45,5 % tyrimo dalyvių) nustatytas lipidų viršūnės pakilimas nuo 0,9 iki 1,33 ppm, 12 pacientų (54,5 %) išaugo lipidų ir laktato lygis, 14 pacientų (63,6 %) padidėjo cholino ir chromo santykis ir viršijo 1,2. Penkių pacientų (22,7 %) šis santykis buvo mažesnis nei 1,2 (susijusios apraiškos plautyje aptiktos 6 pacientams (27,3 %), vienos pacientės gimdos kaklelio limfmazgyje (4,5 %) bei vieno paciento stubure (4,5 %).
Išvados: Magnetinio rezonanso spektroskopija yra itin svarbus tyrimas, leidžiantis nustatyti didžiąją intracerebrinę tuberkulomą ir ją atskirti nuo kitų intrakranijinės erdvės sutrikimų. Tai teikia galimybę pradėti ankstyvąjį tuberkuliozės gydymą, sumažinti pacientų sergamumo ir mirštamumo lygį bei išvengti nebūtinų chirurginių audinių išpjovimo operacijų.
Raktažodžiai: tuberkuliozė (TB), didžioji tuberkuloma, difuzijos svertiniai atvaizdai (DWI), magnetinio rezonanso spektroskopija
___________
* Corresponding author: Deb Boruah, Department of Radiology, All India Institute of Medical Sciences (AIIMS), Guwahati, 780101, Assam, India. Email: debpal8028@gmail.com
Received: 17/10/2022. Revised: 28/11/2022. Accepted: 30/11/2022
Copyright © 2022 Deb Boruah, Kalyan Sarma, Pallavi Gogoi, Binoy Singh, Bidyut Gogoi, Karuna Hazarika, Barun Sharma, Pranjal Phukan. Published by Vilnius University Press. This is an Open Access article distributed under the terms of the Creative Commons Attribution License, which permits unrestricted use, distribution, and reproduction in any medium, provided the original author and source are credited.
Introduction
Tubercular infection of the central nervous system (CNS) is a major public health problem in developing countries like India, with a recent increase in the incidence among immunocompromised patients [1].CNS tuberculosis is the most dangerous manifestation of systemic TB leading to high mortality and morbidity because of its possible serious complications and sequelae [2]. CNS involvement occurs in approximately 5–10% of all cases of tuberculosis [3], and 20% of cases of CNS tuberculosis (TB) are related to acquired immunodeficiency syndrome(AIDS).
Different forms of CNS tuberculosis can be in the form of meningitis, cerebritis, intracranial tuberculomas, miliary tuberculosis, tubercular abscess, calvarial and spinal involvement [4].Of these forms, tubercular meningitis (TBM) followed by intracranial tuberculomas are the most common forms [5]. A tuberculoma consists pathologically of a capsule of collagenous tissue surrounding a central caseation zone [6]. In endemic regions, tuberculomas account for 10% to 30% of intracranial masses [7].
Magnetic resonance imaging (MRI) is superior to computed tomography (CT) for imaging characterization of giant intracerebral tuberculomas. But, there is a substantial overlap in the imaging features with other lesions, such as metastases, gliomas, lymphoma, neurocysticercosis, and fungal granulomas [6,8]. Early differentiation of giant intracranial tuberculoma from other lesions is clinically important because giant intracerebral tuberculomas are potentially curable with prompt anti-tubercular treatment (ATT) or surgery leading to a better prognosis [9].Therefore newer, advanced MR imaging techniques like MR spectroscopy, MR perfusion, diffusion tensor imaging (DTI), and magnetization transfer (MT) imaging are needed in addition to the conventional MRI sequences to improve the diagnostic precision, thereby precluding the requirement for tissue biopsy [10,11].
To date, only a few case reports and case series of such giant tuberculomas have been reported in the literature. But this giant intracerebral tuberculoma is often misdiagnosed as a brain tumor and taken for surgical evacuation.
The purpose of this study is to analyze the clinical data and magnetic resonance imaging (MRI) findings of such giant intracerebral tuberculomas to improve the diagnostic precision.
Methods and Materials
After approval from the institutional ethics review committee, a hospital-based retrospective study was conducted in a tertiary care hospital of Northeast India from May 2019 to April 2021 with a retrospective review of the clinical and MR imaging data of consecutive 22 patients of giant intracerebral tuberculomas. Informed consent was obtained from patients/guardians before undergoing an MRI scan.
Inclusion criteria:
1. Intracerebral tuberculoma of size more than 2.5 cm.
2. For patients with multiple giant intracerebral tuberculomas, the only largest tuberculoma was selected for various MRI characteristics and measurements.
Exclusion criteria:
1. Intracerebral tuberculoma of size less than 2.5cm.
2. Giant tuberculoma mimics which were confirmed histopathologically or confirmed on follow-up imaging.
MRI images were reviewed by two experienced radiologists blinded to the clinical information and examined for the location, size, numbers, perifocal edema and various MRI characteristics of the giant intracerebral tuberculoma.
MRI protocols
All patients were subjected to an MRI scan using the Philips Ingenia1.5 Tesla machine (Netherlands). All patients were subjected to an MRI scan of the brain in a supine position and various MRI sequences were obtained and parameters shown in Table 1.
Table 1. Parameters used in the various conventional MRI sequences of brain
|
MRI sequence |
TE (ms) |
TR (ms) |
Matrix |
Field of view (FOV) |
Slice thickness (mm) |
Flip angle |
Others |
|
T2W axial |
90-110 |
3800-6000 |
512 |
220-250 |
5 |
1500 |
|
|
T1W axial |
8-10 |
500-600 |
512 |
220-250 |
5 |
1500 |
|
|
FLAIR axial |
90-100 |
9000 |
512 |
220-250 |
5 |
1500 |
TI=2500 ms |
|
DWI axial |
90-110 |
3000-4000 |
128 |
220-250 |
5 |
900 |
b-value =0 and 1000sec/mm2 |
|
SWI axial |
40 |
50-60 |
256 |
220-250 |
2 |
150 |
|
|
T1W-sagittal |
8-10 |
500-600 |
256 |
220-250 |
4 |
900 |
|
|
T2W-coronal |
80-95 |
4000-6000 |
512 |
220-250 |
4 |
1500 |
|
|
Post-contrast T1W axial, coronal and sagittal |
8-10 |
500-600 |
512 |
220-250 |
5 |
1500 |
After injecting I.V. Gadopentetate dimeglumine at a dose of 0.1mmol/kg body weight. |
|
MR spectroscopy |
35 and 144 |
2000 |
Multi-voxel (CSI) spectroscopy performed using PRESS sequence. |
Abbreviations: FLAIR=fluid-attenuated inversion recovery, DWI= diffusion-weighted imaging, SWI= susceptibility weighted imaging, TI= time of inversion, TE=time of echo, TR= repetition time
Conventional MRI sequences protocol includes Axial T1WI, T2WI, fluid-attenuated inversion recovery (FLAIR), diffusion-weighted imaging (DWI) and susceptibility-weighted imaging (SWI) sequences followed by sagittal T1WI and coronal T2WI sequences. Post-gadolinium T1WI sequences were obtained in all three planes. Multi-voxel MR spectroscopy was done with TE 144 and TE 35.
Cerebral edema grading
Cerebral edemas associated with tuberculoma were classified as follows: grade-0 – no edema; grade-1 – focal edemaconfined to one lobe; grade-2 – unilateral cerebral edemain more than one lobe; grade-3– bilateral cerebral edema; grade-4 – global cerebral edema with disappearance of sulcul spaces; grade-5 – global cerebral edema with effacement of basal cisterns.
Satellite lesion
Relatively smaller nodular or irregular plaque-like lesions near to the edges of a larger giant tubercular lesion were categorized as satellite lesions.
ADC calculation
Apparent diffusion coefficient (ADC) value measurement of the giant intracerebral tuberculoma were done in b value=1000 s/mm2 DWI images. ADC calculation was obtained both in the peripheral (wall) and central portion(core) of the giant intracerebral tuberculoma. The ADC values were measured independently by the two radiologists and the results were obtained from the mean ADC values. Calculation of the mean ADC values was done by placing either round or elliptical ROIs (region of interest). We measured the mean ADC value in the operating system console using 3 uniform sizes of ROIs (with areas maximum 50 mm2 and minimum 10 mm2) placed in the ADC map image of b=1000sec/mm2, and the mean ADC value was calculated for statistical analysis.
The conventional MRI findings and MR spectroscopy findings were considered as the reference standards in this study for the diagnosis of tuberculoma. Cerebrospinal fluid (CSF) analysis was performed in 19 patients, in 3 patients it was avoided due to fear of intracranial herniation.
Following the provisional MRI imaging diagnosis of tuberculoma, the final diagnosis was confirmed on histopathogical examination in the resected specimens of 4 patients. In the rest of the 18 patients, giant tuberculoma was diagnosed based on a favorable response to the ATT, CSF analysis findings and on associated extra-cranial involvement of tuberculosis. All patients received the standard doses of ATT for a variable interval ranging from 12 months up to 18 months. They were followed up regularly by clinical and serial CT or MRI examinations for clinical and neurological improvement.
Statistical analysis
All statistical analysis was performed using Statistical Package for Social Science (SPSS, version 16). An independent sample student t-test was used to compare the mean ADC values between the central and peripheral portions of the giant intracerebral tuberculoma patients. Statistical significance was considered when the p-value was ≤0.05.
Results
In this study sample of 22 patients the mean age was 27.4 ± 1.36[SD] years with a male-female ratio of 1.4:1. The various MRI findings of the giant intracerebral tuberculoma in 22 patients were summarized in Tables 2 3. Solitary giant tuberculomas were observed in 12 patients (54.5%) [Figure 1], two giant tuberculomas in each individual in 4 patients (18.2%) [Figure 2], more than two giant tuberculomas in 6 patients (27.3%) [Figure 3]. The giant intracerebral tuberculomas were located in the supratentorial compartment in 19 patients (86.4%) [Figures 1, 3 and 4], infratentorial compartment in 2 patients (9.1%) [Figure 5] and both compartments in 1 patient (4.5%).
Table 2. Summary of the T2-weighted and diffusion-weighted imaging (DWI) in 22 patients of giant intracerebral tuberculoma.
|
S/N |
Age /sex |
No of lesion |
Location of lesion |
Size of largest lesion (cm) |
T2W appearance |
DWI appearance (b=1000s/mm2) |
ADC value ( x 10-3mm2/s) |
||||
|
Periphery (wall) |
Centre (core) |
DWI pattern |
Periphery (wall) |
Centre (core) |
Periphery (wall) |
Centre (core) |
|||||
|
1 |
24/M |
2 |
(R)temporal lobe |
4.0 |
Hypo |
Hyper |
Target |
Hyper |
Hyper |
0.385 |
0.522 |
|
2 |
46/F |
3 |
(R) occipital lobe, (R) frontal lobe |
4.7 |
Hypo |
Hypo |
Irregular nodular to rim |
Hyper |
Hypo |
0.740 |
1.097 |
|
3 |
24/M |
3 |
(R) superior frontal lobe, (L) anterior frontal lobe |
2.6 |
Hypo |
Hypo |
Smooth peripheral |
Hyper |
Hypo |
1.036 |
1.083 |
|
4 |
22/F |
1 |
(R) parietal lobe |
2.8 |
Hypo |
Hypo |
NAD |
Hypo |
Hypo |
1.102 |
1.230 |
|
5 |
26/M |
1 |
(L)parietal lobe |
3.4 |
Hypo |
Hypo |
NAD |
Hypo |
Hypo |
0.655 |
0.450 |
|
6 |
29/F |
3 |
(R)temporal , bilateral basi-frontal lobes |
3.2 |
Iso |
Hypo |
Target |
Hyper |
Hyper |
0.863 |
1.257 |
|
7 |
46/F |
1 |
(L) parietal lobe |
5.2 |
Iso |
Hyper |
Irregular nodular to rim |
Hypo |
Hyper |
1.430 |
0.470 |
|
8 |
30/M |
1 |
(L) frontal lobe |
3.7 |
Hypo |
Hypo |
Target |
Hyper |
Hypo |
0.796 |
1.201 |
|
9 |
26/F |
1 |
(L) thalamus |
4.5 |
Hypo |
Hyper |
Target |
Hypo |
Hyper |
1.286 |
0.890 |
|
10 |
54/M |
1 |
(L) frontal lobe |
2.6 |
Iso |
Hypo |
NAD |
Hypo |
Hypo |
1.952 |
1.051 |
|
11 |
38/M |
1 |
(R)frontal lobe |
2.7 |
Hypo |
Iso |
Irregular nodular to rim |
Hypo |
Hyper |
1.216 |
1.344 |
|
12 |
26/F |
3 |
Bilateral frontal and parietal lobes |
5.6 |
Hypo |
Hyper |
Target |
Hyper |
Hypo |
0.690 |
1.415 |
|
13 |
7/F |
1 |
(R) frontal lobe |
4.8 |
Iso |
Hypo |
Irregular nodular to rim |
Hyper |
Hypo |
0.996 |
1.047 |
|
14 |
14/F |
3 |
(R)frontal lobe |
4.2 |
Iso |
Iso |
Target |
Hyper |
Hyper |
0.988 |
0.780 |
|
15 |
37/M |
2 |
(L)parietal lobe |
2.6 |
Hypo |
Iso |
Irregular nodular to rim |
Hypo |
Hyper |
0.591 |
0.980 |
|
16 |
17/M |
3 |
(R) frontal lobe, (L) cerebellum |
3.2 |
Hypo |
Hyper |
Irregular nodular to rim |
Hypo |
Hyper |
0.944 |
0.552 |
|
17 |
18/M |
1 |
(L)frontal lobe |
2.56 |
Hyper |
Hypo |
Irregular nodular to rim |
Hypo |
Hyper |
1.106 |
0.472 |
|
18 |
21/M |
1 |
(R) temporal lobe |
6.1 |
Iso |
Iso |
Irregular nodular to rim |
Hypo |
Hyper |
0.621 |
0.613 |
|
19 |
56/M |
1 |
(L)temporal lobe |
2.58 |
Iso |
Iso |
Irregular nodular to rim |
Hypo |
Hyper |
0.821 |
0.570 |
|
20 |
11/M |
2 |
Bilateral frontal, (L) temporal,(L) parietal, (L)occipital lobes |
2.8 |
Iso |
Hypo |
Smooth peripheral |
Hyper |
Hypo |
1.143 |
1.462 |
|
21 |
13/M |
2 |
(R) cerebellum |
2.73 |
Hypo |
Hypo |
NAD |
Hypo |
Hypo |
0.907 |
0.979 |
|
22 |
18/F |
1 |
(R) cerebellum |
2.7 |
Iso |
Hypo |
NAD |
Hypo |
Hypo |
2.500 |
2.410 |
Abbreviations: ADC=apparent diffusion coefficient, Hypo=hypointense, Hyper=hyperintense, Iso= isointense, NAD=no abnormality detected
Headache (95.4%), fever (81.8%) and vomiting (68.2%) were the most common presenting symptoms. Four patients (18.2%) had altered sensorium, 3(13.6%) had seizures and 2(9%) had hemiparesis.
All giant tuberculoma incite perifocal cerebral edema: grade-1 in 4 patients (18.2%), grade-2 in 12 patients (54.5%) [Figures 1 and 4], grade-3 in 5 patients (22.7%) [Figure 3] and grade-4 in 1 patient (4.5%). Satellite lesions were observed in 15 patients (68.2%)[Figure 4]. Obstructive hydrocephalus observed in 9 patients (40.9%).The mean of largest diameter of giant tuberculoma measures 3.6 ± 1.1[SD] cm.
On T2W images, the peripheral wall of the giant tuberculoma showed T2 hypointense signal intensities in 12 patients (54.5%) [Figure 3], isointensities in 9 patients (40.9%) [Figures 2 and 4] and hyperintensities in 1 patient (4.5%). The central portion(core) of the giant tuberculoma on T2W images showed hypointense signal intensities in 12 patients (54.5%) [Figures 1,2 and 5], isointensities in 5 patients (22.7%) [Figure 4] and hyperintensities in another 5 patients (22.7%) [Figure 3]. On T1W images, the wall of the giant intracerebral tuberculoma showed T1 hyperintensities in 14 patients (63.6%) [Figure 4] and isointensities in 8 patients (36.4%) [Figure 2]. The maximum thickness of the wall of the giant intracerebral tuberculoma on T2W image measures 4.2± 2.8[SD] mm. On SWI, 16 patients (72.7%) with giant tuberculoma showed peripheral wall blooming representing microhemorrhages within walls.
On DWI, irregular nodular to peripheral rim-like diffusion restriction was seen in 9 patients (40.9%) [Figure 3], concentric target-appearing diffusion restriction in 6 patients (27.3%) [Figure 4] and smooth rim-like diffusion restriction in 2 patients (9.1%). No diffusion restriction was observed in 5 patients (22.7%). The mean ADC value of the peripheral wall of the giant tuberculoma was 1.034± 0.466[SD] x 10-3mm2/s and the central portion was 0.994± 0.455[SD] x 10-3mm2/s. There was a statistically significant difference (p-value <0.0005) between the mean of ADC values of peripheral wall and core of giant tuberculoma while using unpaired Student t-test.
Smooth peripheral wall enhancement post-contrast scan was observed in 3 patients (13.6%) of giant tuberculoma[Figure 2], irregular shaggy to nodular peripheral enhancement in 13 patients (59.1 %) [Figure 1] and mixed-pattern of enhancement in 6 patients (27.3%). 19 out of 22 cases of giant intracerebral tuberculoma showed raised Choline/Cr ratio on multi-voxel spectroscopy[Figures 3,4 and 5]. Choline/Cr ratio more than 1.2 was observed in 14 patients(63.6%) and Choline/Cr ratio less than 1.2 in 5 patients (22.7%). Raised lipid peak at 0.9 to 1.33 ppm was observed in 10 patients (45.5%) [Figures 3 and 4]. Raised lipid-lactate peak observed in 12 patients (54.5%) [Figure 2].
Six patients (27.3%)of giant intracerebral tuberculoma had association with lung involvement [Figure 3], 1 patient (4.5%) had cervical lymphadenitis and another 1 patient (4.5%) had Pott’s spine [Figure 5].
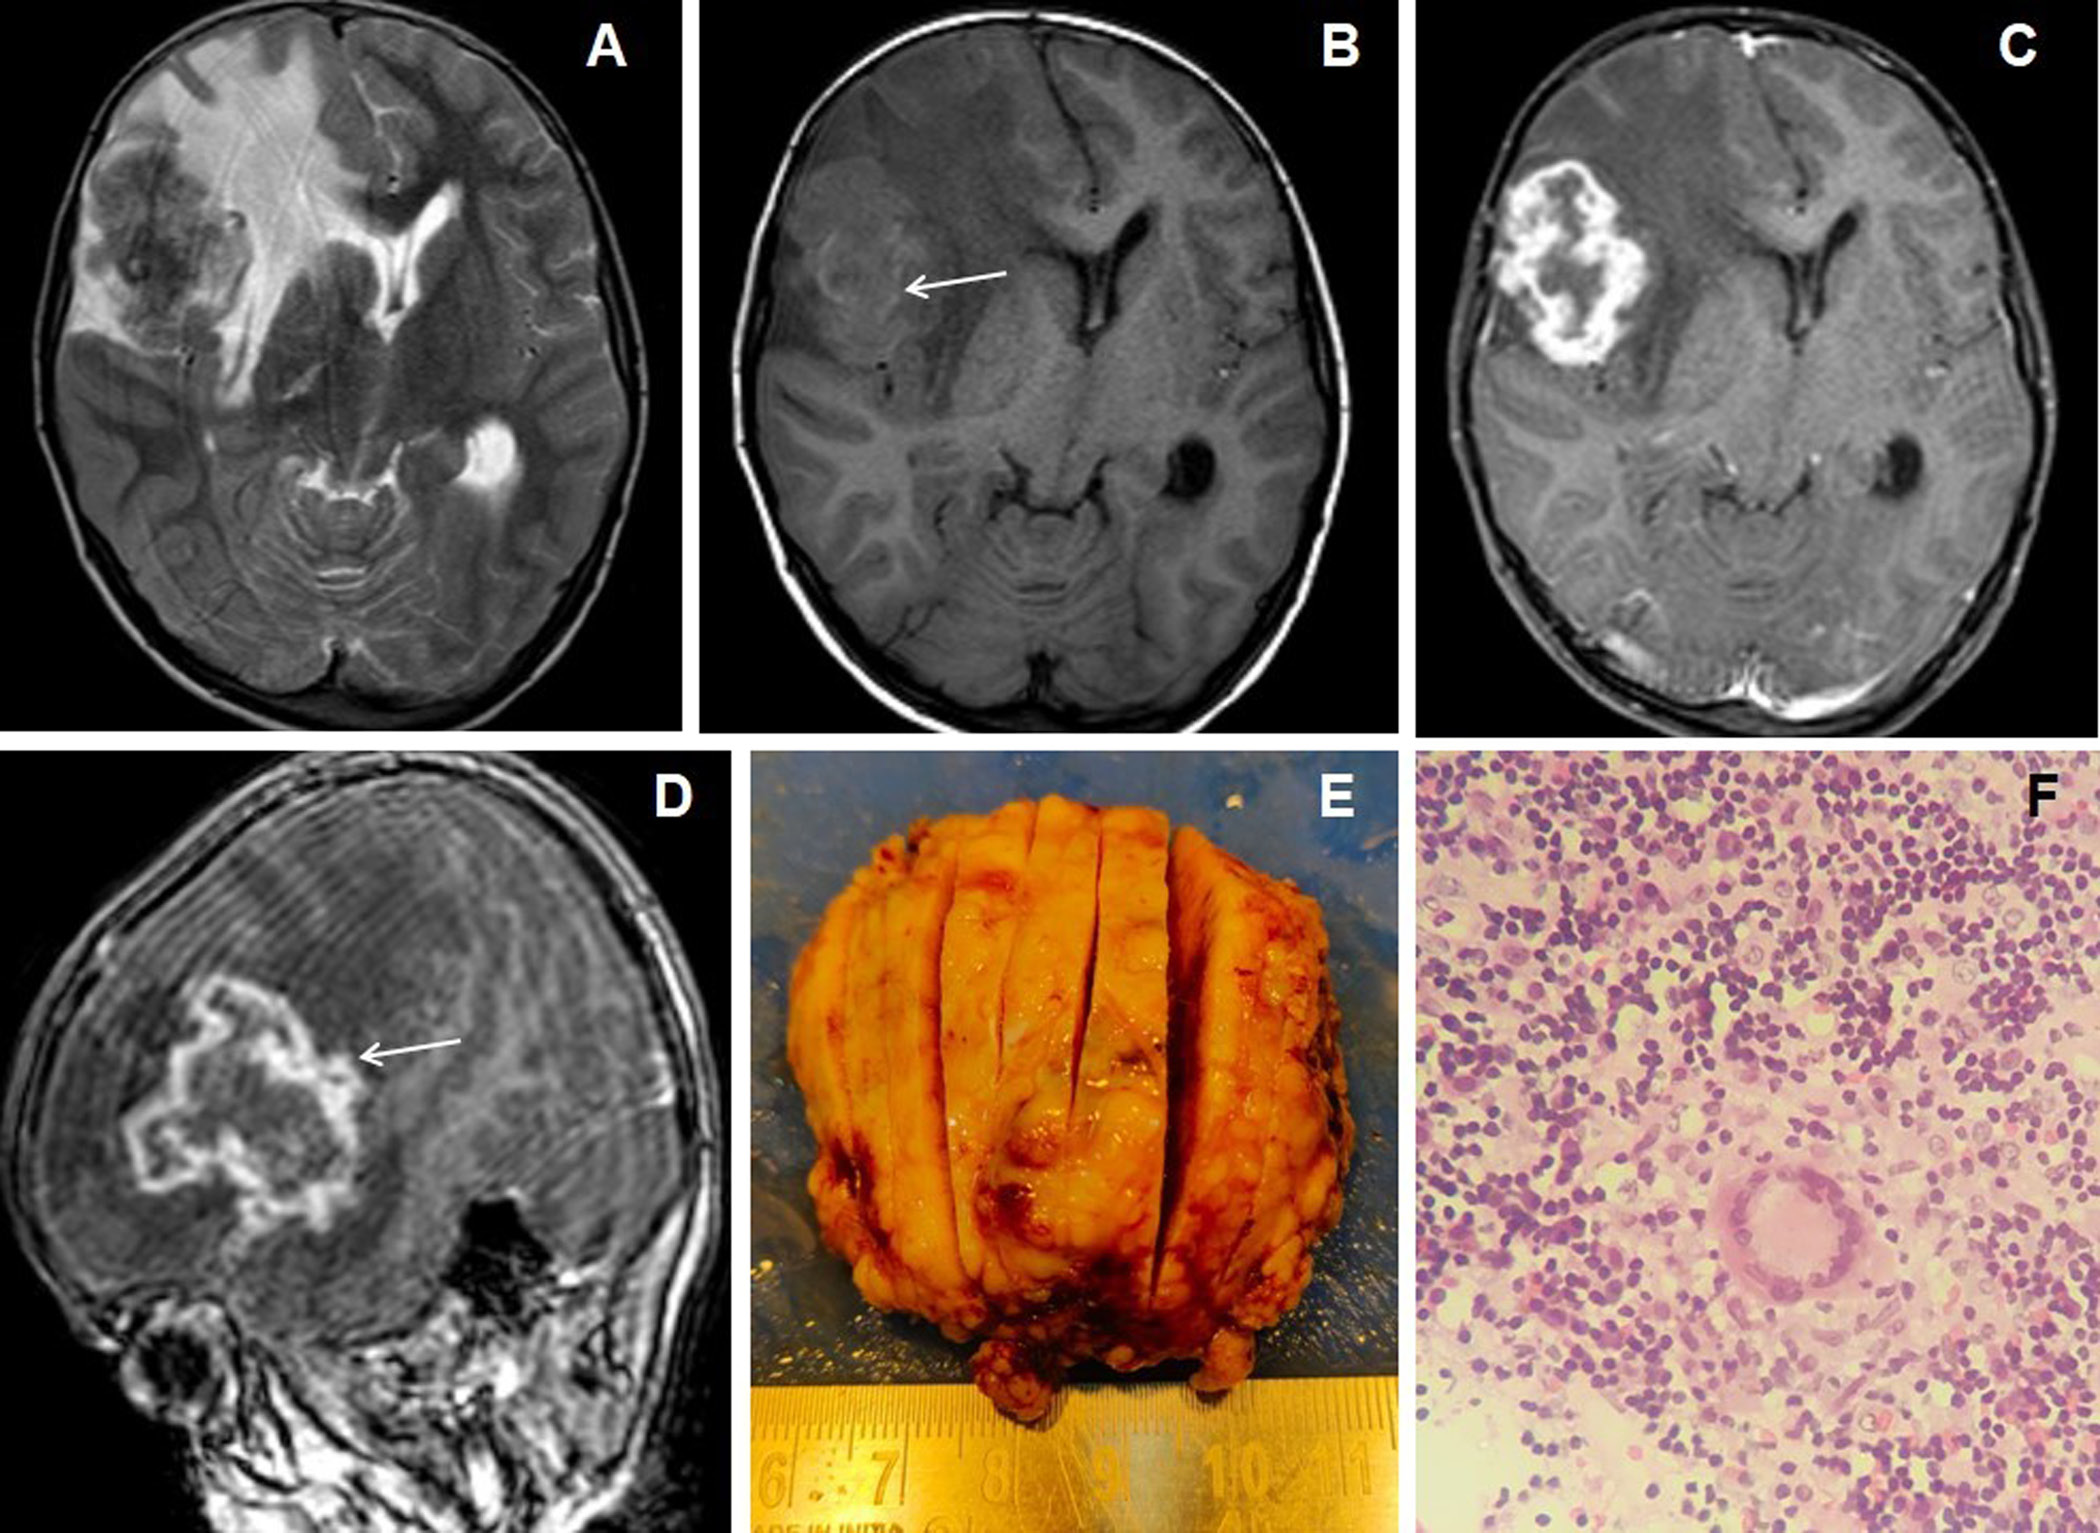
Figure 1. 7 years female presented with headache, vomiting and seizures. The axial T2W image (A) shows an irregular marginated T2 hypointense mass-like lesion in the right frontal lobe with grade-2 perifocal edema and associated mass effect. Axial T1W image (B) shows irregular peripheral T1 iso- to hyperintensities within the lesion (arrow). Axial and sagittal post-contrast images (C&D) show irregular shaggy peripheral wall enhancement of the lesion (arrow) with necrotic central core. The gross specimen (image E) shows the grayish-brown tissue of the lesion. 10X magnification microscopic examination (image F) shows caseous necrosis with epithelioid granulomas surrounded by lymphocytes.
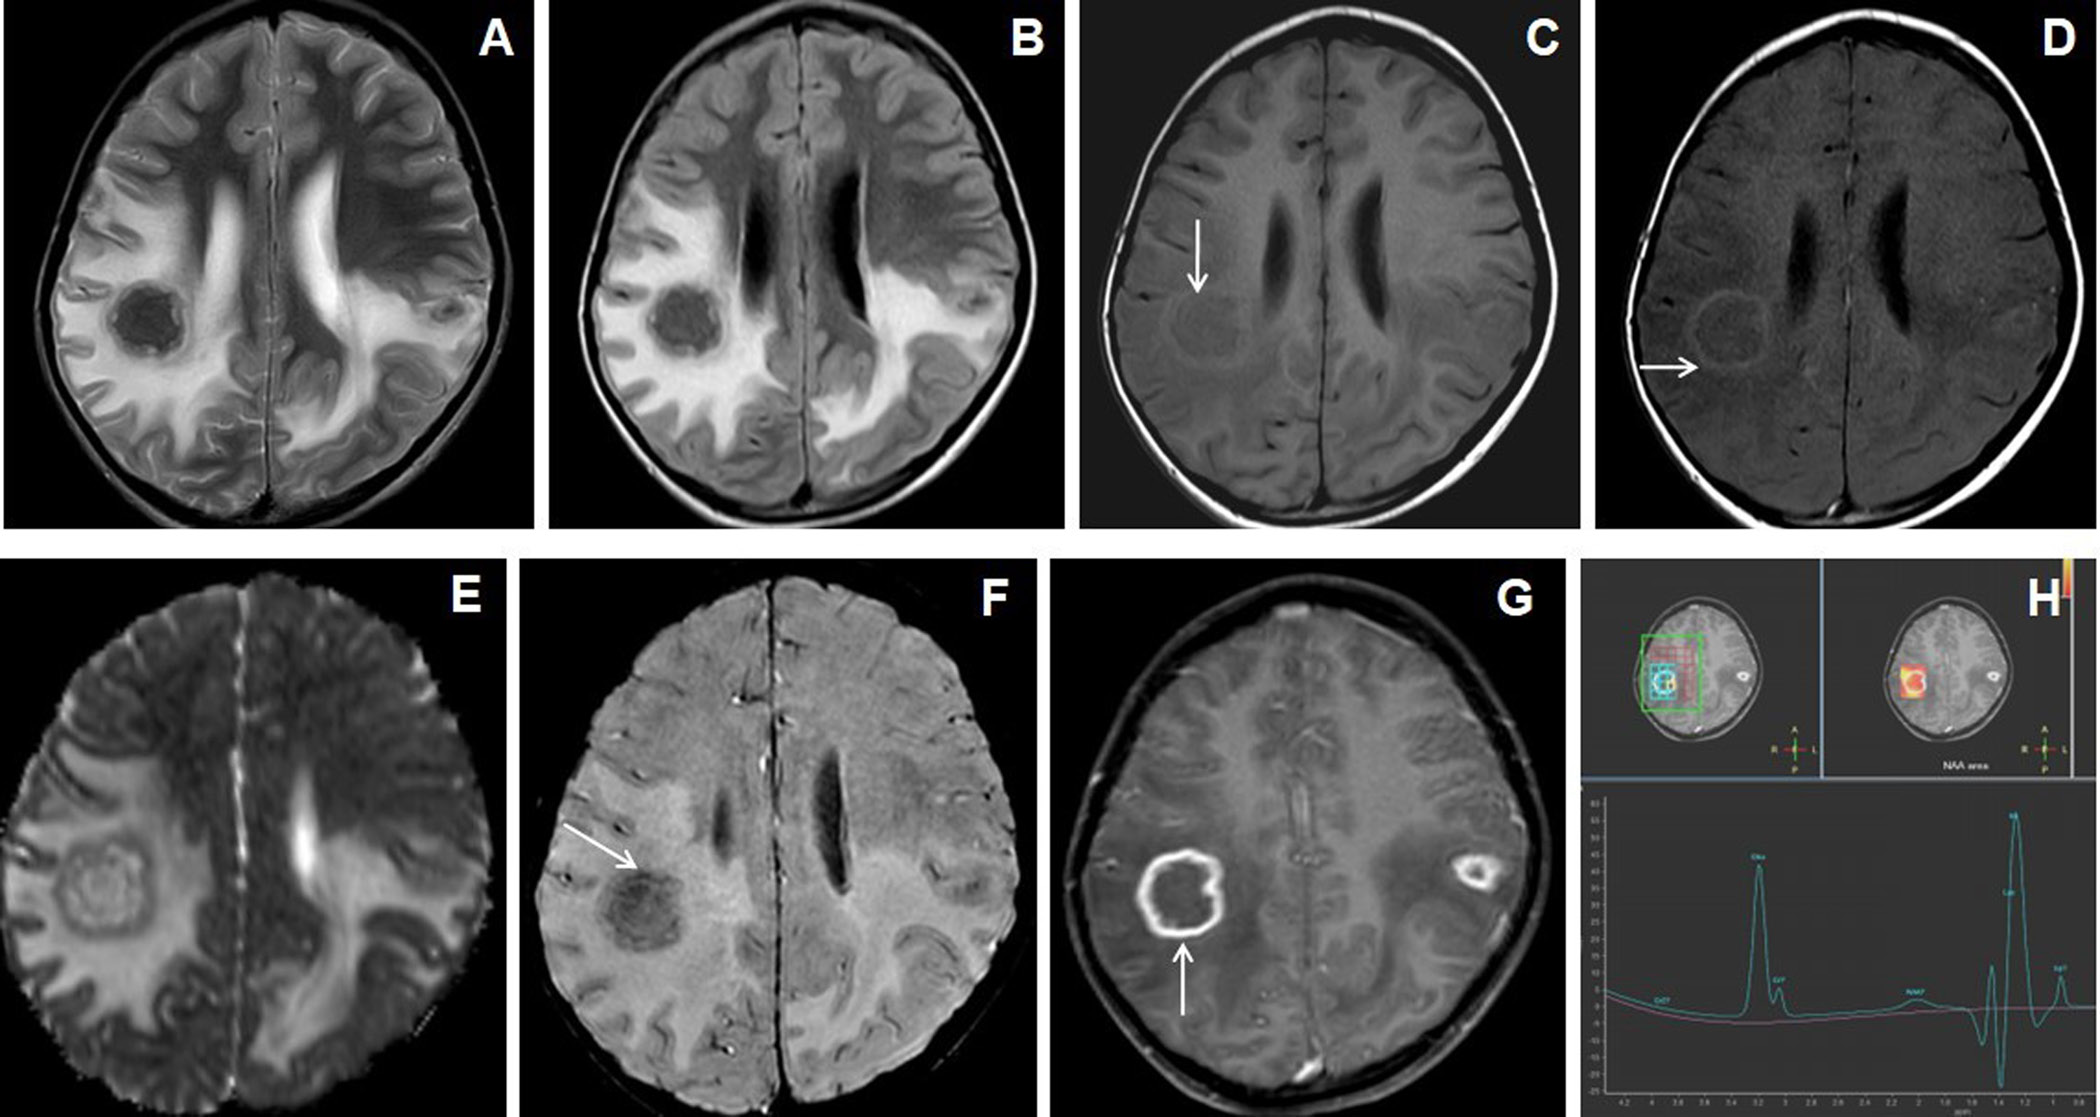
Figure 2. 11 years male presented with headache, vomiting and seizures. Axial T2W and FLAIR images (A & B) show nodular lesions with central T2 hypointense core and isointense peripheral wall in the bilateral parietal lobes with grade-3 perifocal edema. Axial T1W image (C) showed isointense central core and hyperintense peripheral wall (arrow). Axial magnetization transfer (MT) image (D) shows a positive MT effect with bright signals within the wall of the nodular lesions(arrow). Axial ADC map image (E) shows slight peripheral wall diffusion restriction with low ADC value and facilitated diffusion in the core. Axial SWI image (F) shows blooming of hemorrhages in the peripheral wall (arrow). Axial post-contrast image (G) shows irregular shaggy peripherally enhancement of the lesions with central necrosis (arrow). MR spectroscopy (TE 144) image (H) shows a large lipid-lactate peak at 1.3ppm with raised choline peak.
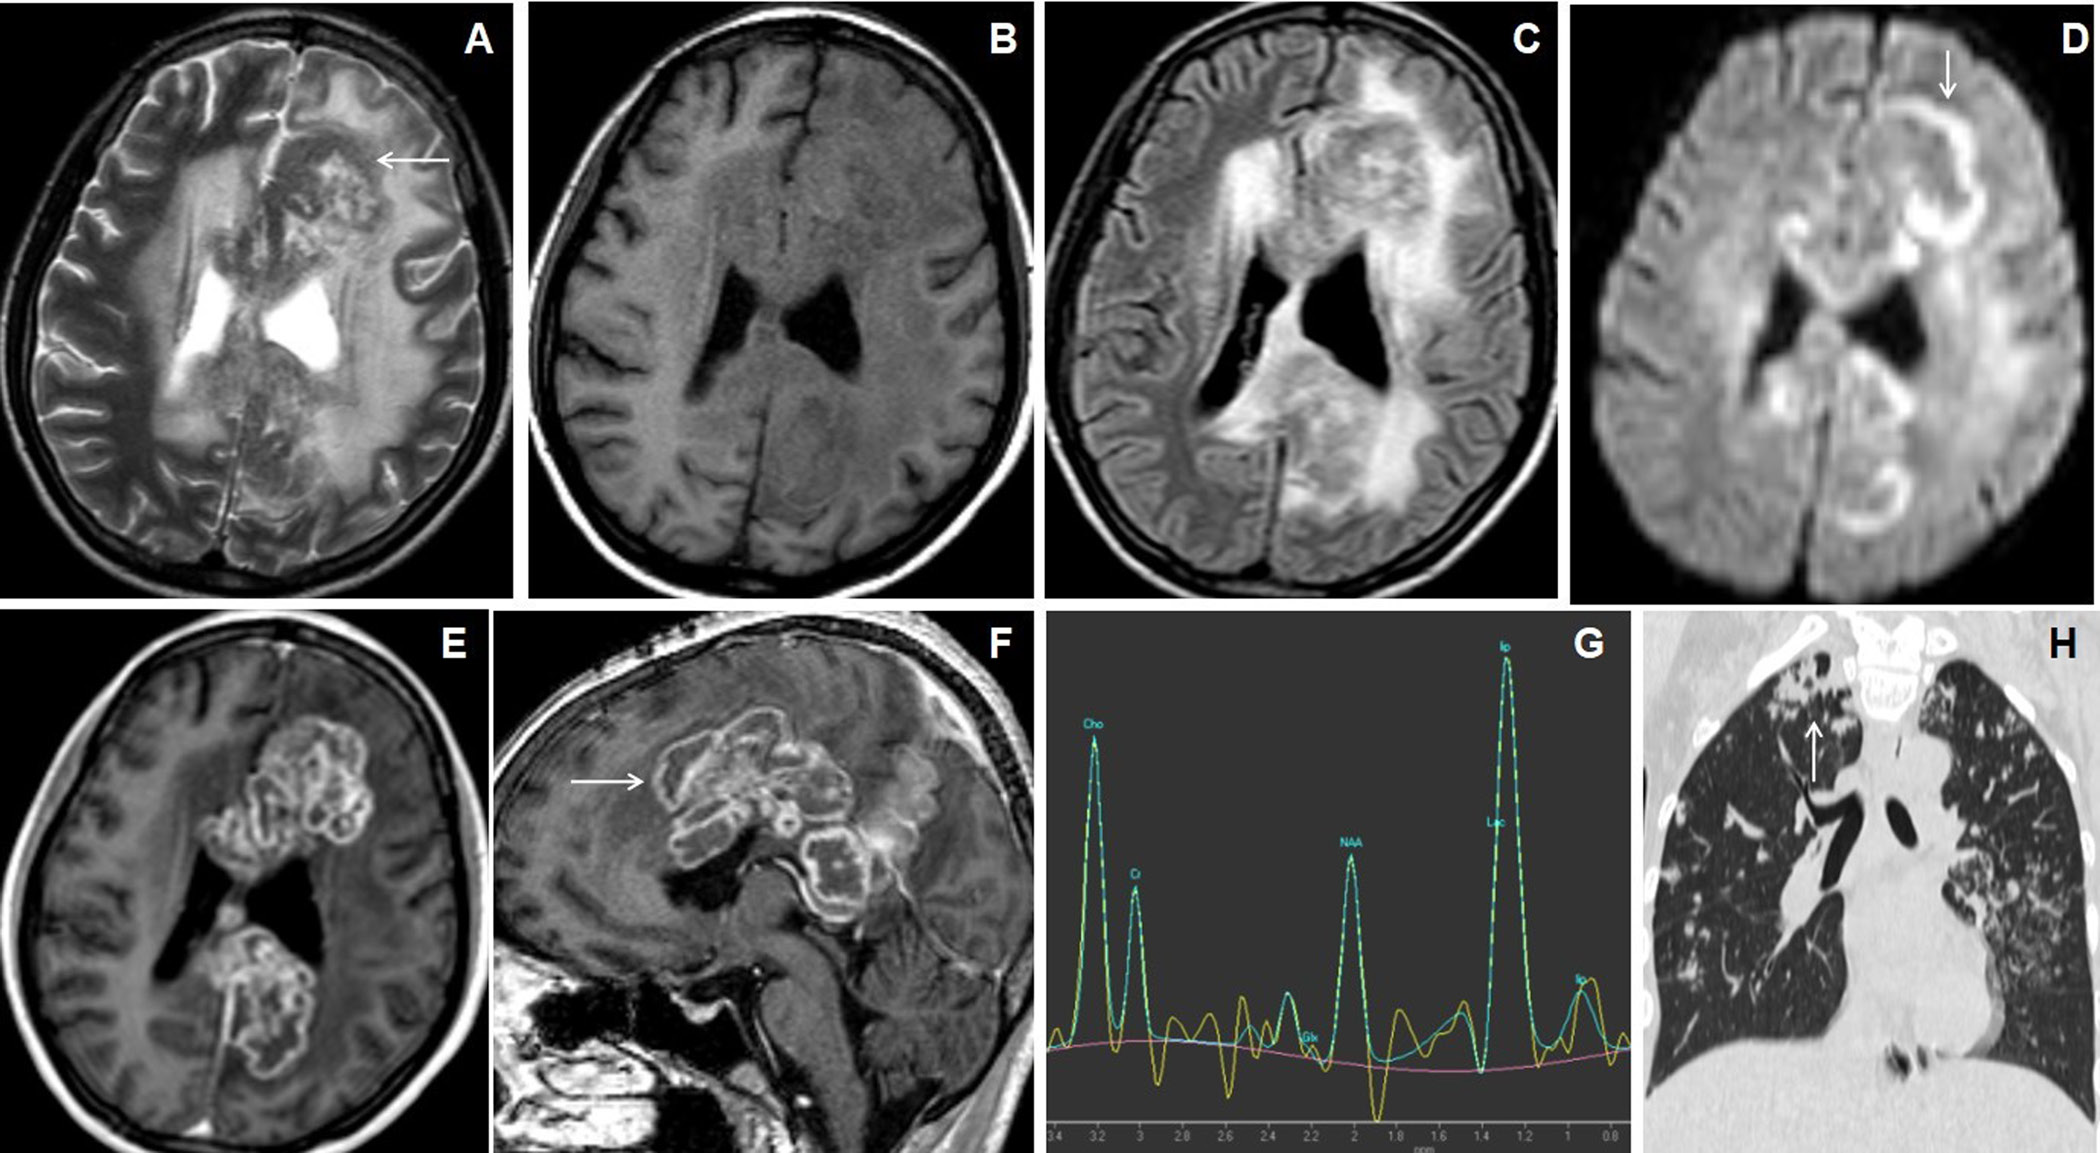
Figure 3. A 26 years female presented with gradually increasing headache and fever of 2 months duration. The cranial MRI with axial T2W image (A) shows irregular lesions with central T2 hyperintense core and peripheral hypointense wall (arrow) involving bilateral superior frontoparietal lobes in the para-falcine regions with grade-3 perifocal edema. Axial T1W image (B) shows hypointense central core and iso- to slight hyperintensities within peripheral wall. Axial FLAIR image (C) shows the involvement of the corpus callosum. Axial DWI image (D) shows irregular peripheral diffusion restrictions within wall (arrow). Axial and sagittal post-contrast images (E&F) show multiple conglomerated irregular peripherally enhancing lesions with central necrosis (arrow). MR spectroscopy (TE 144) image (G) shows a large lipid peak at1.3ppm with raised choline peak. HRCT coronal reconstructed (H) of the thorax shows an irregular cavitating lesion in the apical segment of right upper lobe of lung (arrow) with ill-defined scattered irregular nodules in both lung fields.
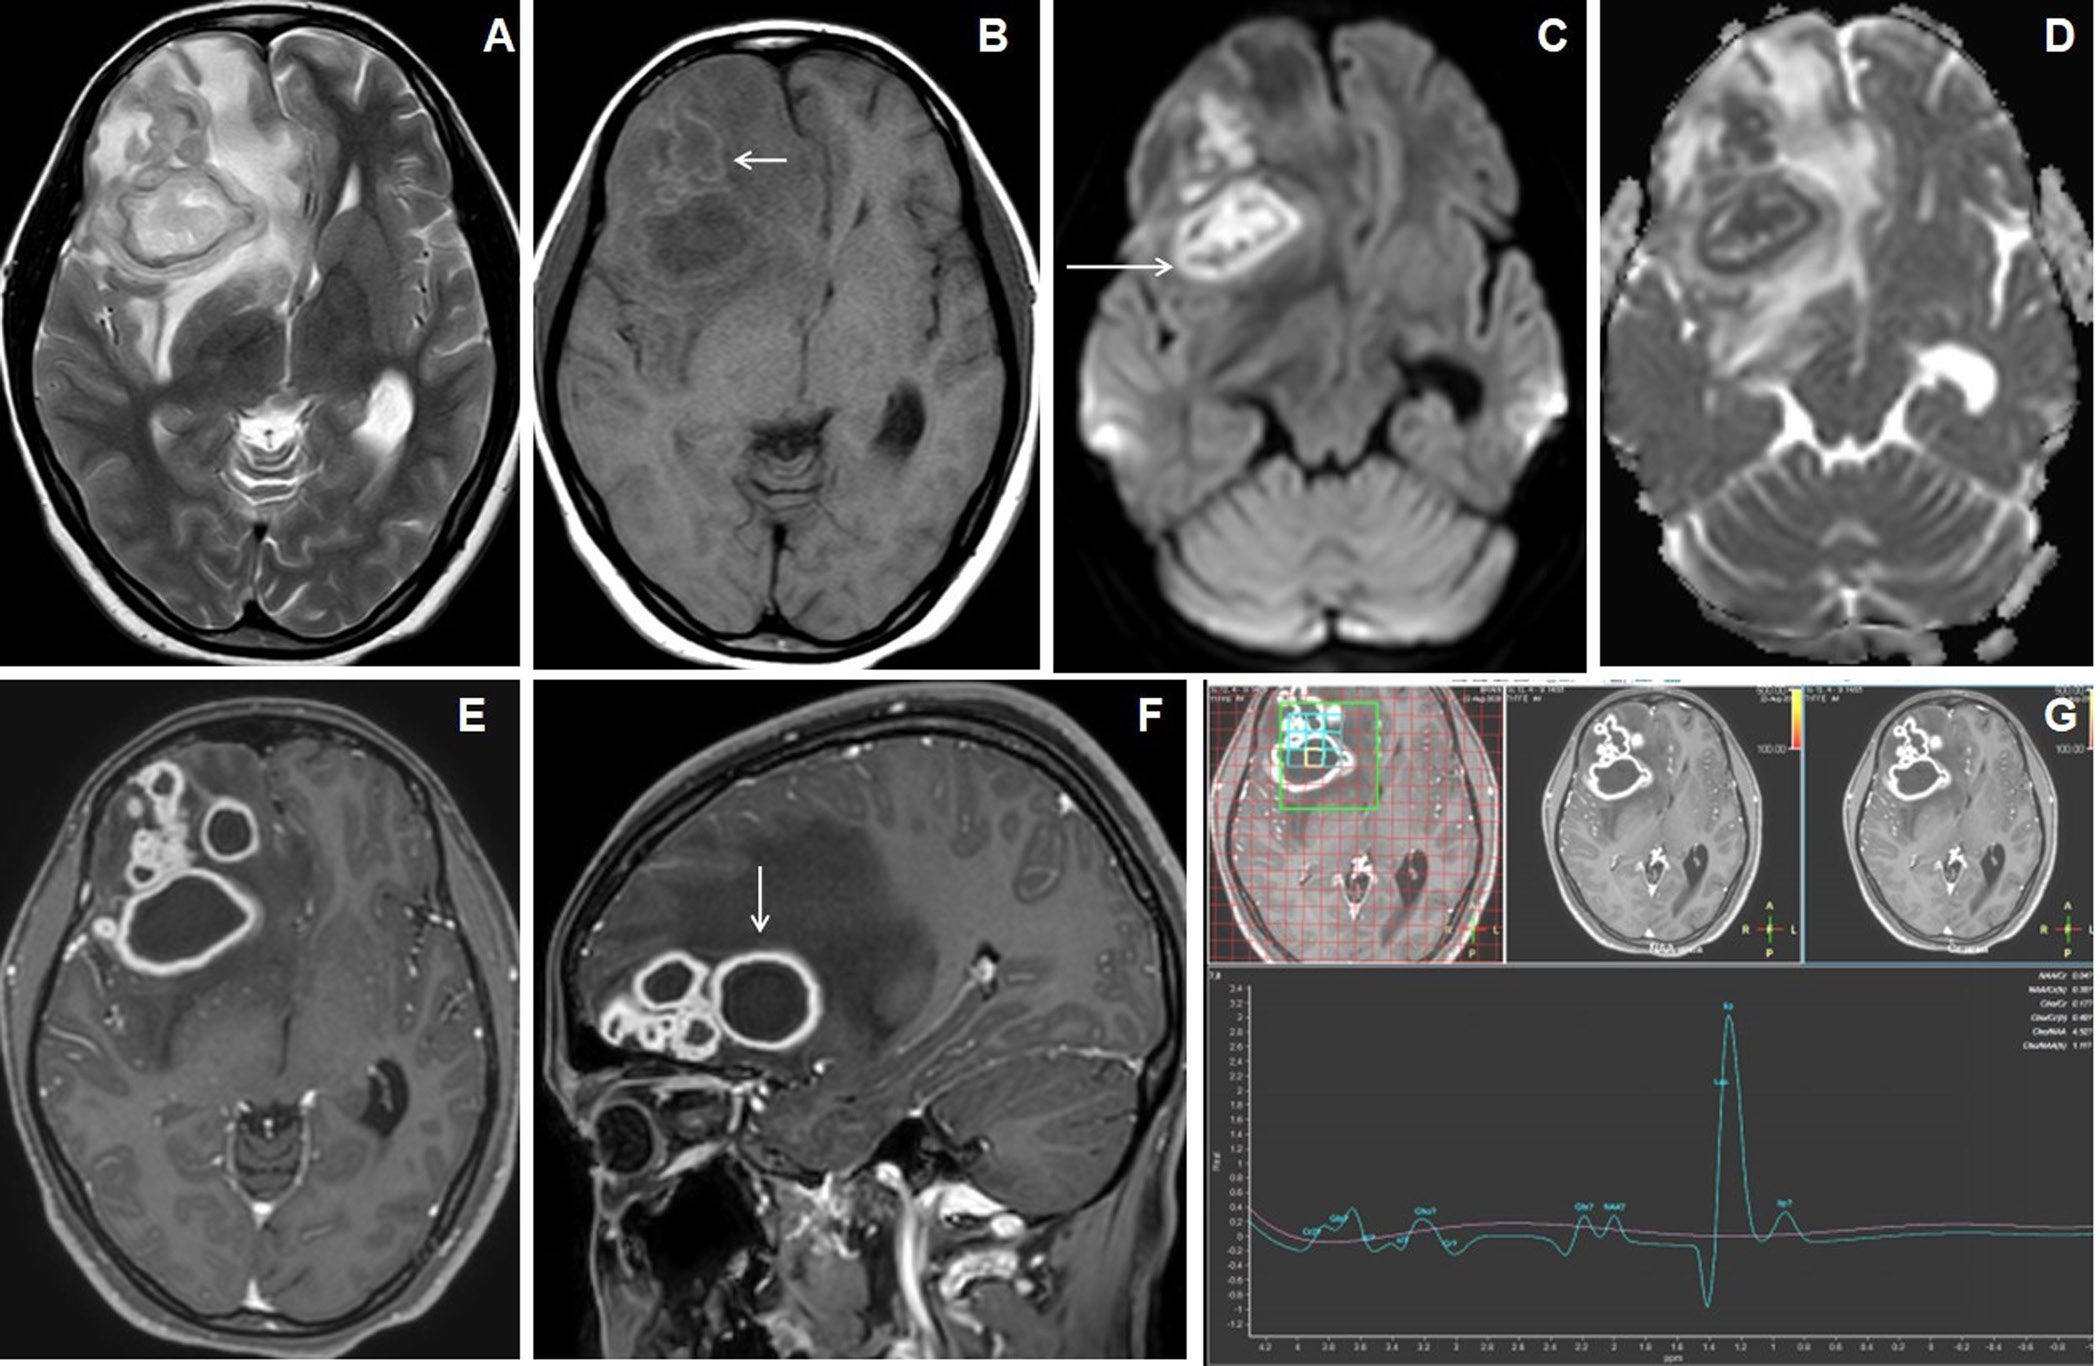
Figure 4. 18 years female presented with headache and vomiting. Axial T2W image (A) shows multiple conglomerated lesions with hyper- to mixed-signal intense central core and isointense peripheral walls in the right frontal lobe with grade-2 perifocal edema. Axial T1W image (B) shows central hypointense core and iso- to slight hyperintense peripheral wall. Axial DWI and ADC map images (C&D) show irregular target-appearing diffusion restrictions (arrow). Axial and sagittal post-contrast images (E&F) show multiple conglomerated irregular peripherally enhancing lesions with central necrosis (arrow). MR spectroscopy (TE 144) image (G) shows a large lipid peak at 1.3ppm.
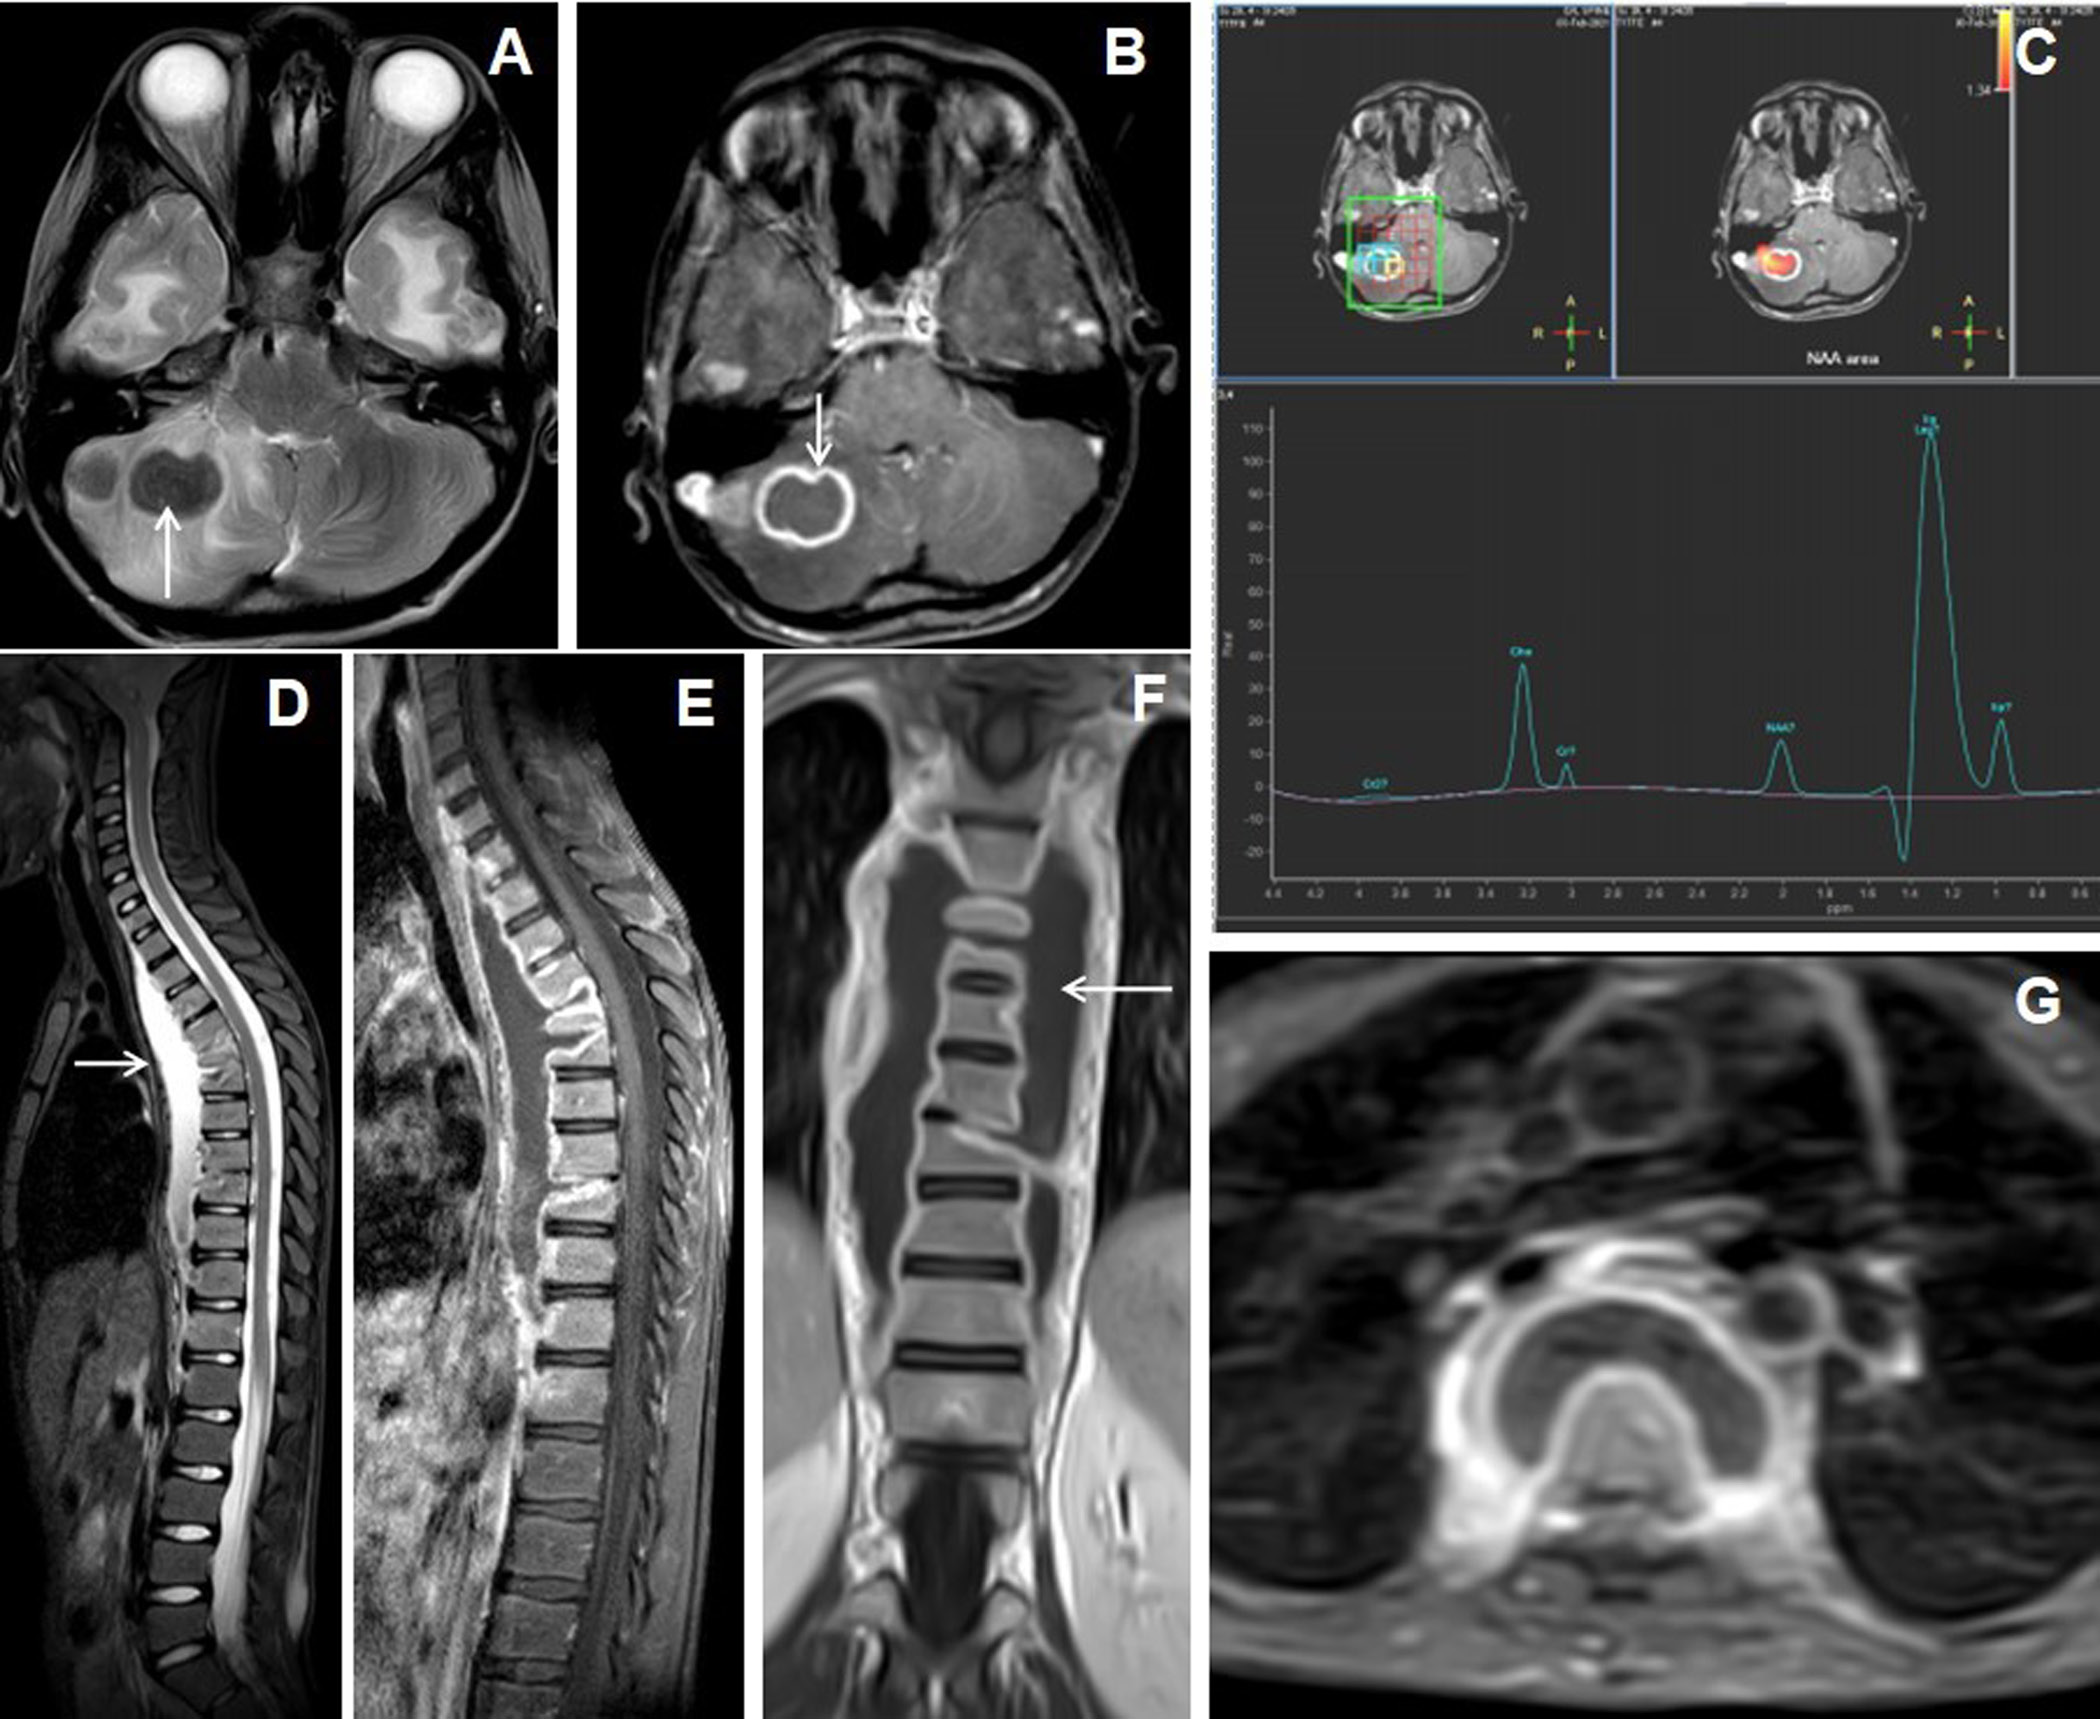
Figure 5. 13 years male presentedwith headache, vomiting and chronic backache. Cranial MRI with axial T2W image of the brain (A) shows hypointense nodular lesions in right cerebellum with perifocal edema. Axial post-contrast image (B) shows a larger irregular shaggy peripherally enhancing rim-like lesion with central necrosis (arrow) and adjacent laterally located solid nodular enhancing satellite lesion. MR spectroscopy (TE 144) image (C) shows lipid peak in 1.3ppm with slightly raised choline peak. The sagittal STIR image of spine (D) shows abnormal STIR hyperintensities in multiple lower cervical and dorsal vertebrae with partial collapse of the D5, D6 and D9 vertebrae and associated T2 hyperintense long segmental prevertebral collection in the cervico-dorsal region (arrow).
CSF analysis showed pleocytosis in 19 patients, lymphocytic predominance in 17 patients (89.5%) and neutrophilic predominance in 2 patients (10.5%). CSF protein was elevated in 16 patients (84.2%) and glucose was low in 15 patients (78.9%). Four patients were treated with surgical decompression followed by medical treatment with ATT and the rest of the 18 patients managed with only medical treatment. Histopathogical examination in the resected specimens of 4 patients showed epitheloid cells admixed with lymphocytes representing tubercular granuloma. In the rest of the 18 patients, giant tuberculoma was diagnosed based on a favorable response to the ATT, CSF analysis findings and on associated extra-cranial involvement of tuberculosis.
Discussion
CNS tuberculosis is associated with a high mortality rate and morbidity due to grave neurological complications and sequelae [5]. Tuberculous meningitis and intracranial tuberculomas are the main forms of CNS tuberculosis [5]. In endemic regions like India, intracranial tuberculomas presenting as space-occupying lesions are not uncommon, where it still accounts for 10% to 30% of all intracranial masses [7,12]. Intracranial tuberculomas arise when small tubercles conglomerate and enlarge in the brain parenchyma [5]. Rupture of these intracranial tuberculomas into the subarachnoid space may sometimes result in tuberculous meningitis [13,14]. Intracranial tuberculomas characteristically show granulomatous reaction forming noncaseating granuloma, that later develops caseating necrosis in the central area, which is at first solid, but subsequently liquefy [12].Mostly, typical tuberculomas are oval or rounded in shape, measuring around 2–12 mm in size [15]. Rarely, multiple intracranial tuberculomas may merge and increase in size resulting in giant tuberculoma, presenting clinically with features of mass effect and raised intracranial pressure [6]’
Intracranial tuberculomas can develop at any age [12]. However, previous studies in the literature [5] reported the mean age of occurrence of intracranial tuberculomas between 24 and 42 years of age, which was comparable to our series, with a mean age27.4 ± 1.36 years.
Intracranial tuberculomas may present with various clinical symptoms attributable to their size and location. In the previous studies of giant intracranial tuberculomas, the headache was the most common presentation, followed by seizure, features of raised intracranial pressure, and focal neurological deficits, limb weakness [6]. In our study also, the headache was the most common presentation followed by fever and vomiting.
The previous studies on giant tuberculomas reported extracranial tubercular involvement in approximately 21% of cases[Table 4]. In our series concomitant extracranial tubercular involvement in the form of pulmonary TB was seen in 6 patients (27.3%), cervical lymphadenitis in 1 patient (4.5%) and Pott’s spine in another 1 patient (4.5%).
The supratentorial location is most often observed in adults, whereas the infratentorial location is most often observed in children [6,12,16]. In our series also, the majority of the giant tuberculomas were in the supratentorial area, detected in 19 patients (86.4%).
MRI plays a vital role in the diagnosis of intracranial tuberculomas due to its innate specificity and sensitivity in its early detection as compared to CT imaging [16].In MRI the appearance of intracranial tuberculoma depends on the stage of maturation. Noncaseating intracranial tuberculomas appear hypointense on T1WI, hyperintense on T2WI with homogeneous nodular enhancement on the post-contrast study. Tuberculomas with solid central caseation appear as hypo- to isointense on both T1 and T2 weighted images with iso- to hyperintense rim on T2WI and peripheral rim-like post-contrast enhancement. On the other hand, intracranial tuberculomas with central liquefaction appear hypointense on T1WI and hyperintense on T2WI with peripheral hypointense rim which shows irregular rim-like peripheral enhancement on the post-contrast study [6,9,12,14,17,18]. Central region of T2 hypointensity is a valuable finding in tuberculoma as it is not found in several other space-occupying lesions [19].In our series, 12 patients (54.5%)of giant tuberculoma demonstrated a central region of T2 hypointensity.
Intracranial tuberculomas may show different patterns of enhancement on post-contrast study ranging from open rings, complete rings, lobular, or irregular patterns [6]. In our series, the most common patterns of enhancement of giant tuberculoma on post-contrast study were irregular nodular and shaggy rim enhancementsin 13 patients (59.1%)[Table 3].
The features of conventional MRI are sometimes nonspecific and may overlap with other tumoral and infective lesions leading to diagnostic dilemmas [1,6,8,20]. So additional advanced MR imaging techniques like magnetic resonance spectroscopy (MRS), MR perfusion, diffusion tensor imaging (DTI), and magnetization transfer (MT) imaging are needed to improve diagnostic accuracy.
On magnetisation transfer (MT) T1WI, the cellular content of the noncaseating intracranial tuberculomas appear brighter, which is specific and helps in distinguishing them from other intracranial space-occupying lesions like lymphoma, metastases, and other infective lesions. However, on MT T1WI, these lesions surrounded by a hyperintense rim favors tuberculoma [11,12].
Solid caseating intracranial tuberculomas do not demonstrate diffusion restriction, which helps in distinguishing them from other lesions like lymphoma and medulloblastoma. On the other hand, intracranial tuberculomas with central liquefaction show diffusion restriction on DWI [13]. In our series, irregular nodular to peripheral rim-like diffusion restriction was seen in 9 patients (40.9%), concentric target-appearing diffusion restriction in 6 patients (27.3%) and smooth rim-like diffusion restriction in 2 patients (9.1%) [Table2].
Magnetic resonance spectroscopy (MRS) demonstrates typically elevated lipid peak which helps in distinguishing tuberculomas from other malignant and infective conditions [11,21]. Intracranial tuberculomas can also demonstrate a decrease in N-acetyl aspartate (NAA) and creatinine, with a raised choline/creatinine ratio of >1 [6,22]. NCC can demonstrate elevated lactate, with increased proteins like succinate, glutamate, alanine, glycine, and a decrease in creatinine and NAA [23]. Pyogenic brain abscess demonstrates raised levels of amino-acid peaks. Glioma or metastatic lesions reveal an elevated choline peak significantly with or without lipid/lactate peaks depending on tumor grade or necrosis [6,23].
In our series, the presumptive diagnosis of intracranial giant tuberculomas was based on clinical features and characteristic MR imaging findings. Previous studies [6,20,24] have reported a favorable outcome in most cases of giant tuberculomas following medical treatment alone with ATT for 6 to 24 months [Table 4]. The present study also showed a favorable outcome in 18 cases of giant tuberculomas following only medical treatment with ATT. Therefore, the empirical use of ATT can be tried after a presumptive diagnosis of giant tuberculoma in endemic regions. However, sometimes giant tuberculoma may need urgent surgical intervention in view of increasing mass effect and neurological deficit.
Positive responsiveness of a giant intracerebral tuberculoma to the anti-tubercular therapy (ATT) can be assessed with reduction of thickness and signal intensity of peripheral T1WI hyperintensity, squeezing and reduction of T2WI hypointense central core of the tuberculoma, increased peripheral wall blooming of micro-haemorrhages on SWI images as compared to the pre-treatment MRI appearances of tuberculoma.
The common differential for rim-enhancing SOL in the cerebellum would be metastasis and pyogenic brain abscess, where dynamic contrast-enhanced MR perfusion and MR spectroscopy play important role in their differentiation. The mean rCBV ratio of peripheral wall of tuberculoma to normallyappearing white matter is around one while mean rCBV ratio is more than 5 in metastasis[28]. MR spectroscopy also plays important role in differentiating neoplasm and pyogenic abscess from tuberculomas. MR spectroscopy reveals larger lipid peak in tuberculoma. Presence of lactate is observed in caseating tuberculomas, however lipid lactate peak is not specific for tuberculoma, and it can be raised in glioma and metastasis[29].
Limitations of the study
Because of small sample in our study, a larger sample size is needed to confirm these MRI findings in the diagnosis of the giant intracerebral tuberculomas, and to differentiate them from other mimics.
Conclusion
Giant tuberculomas are rare lesions but should be considered in the differential diagnosis of intracranial space-occupying lesions in an endemic regions like India. Early diagnosis of giant tuberculomas is clinically important, as they are treatable with ATT, leading to a better prognosis. MR imaging plays a vital role in distinguishing giant tuberculomas from other intracranial space-occupying lesions, thereby precluding the requirement for tissue biopsy. However, sometimes diagnosis can be challenging due to atypical imaging features leading to diagnostic dilemma. An accurate MRI diagnosis allows the early institution of ATT, decreased patient morbidity, mortality, and prevents unnecessary neurosurgical excision.
References
- Batra A, Tripathi RP. Diffusion-weighted magnetic resonance imaging and magnetic resonance spectroscopy in the evaluation of focal cerebral tubercular lesions. Acta Radiol. 2004;45(6):679–88. doi: 10.1080/02841850410001169
- Bernaerts A, Vanhoenacker F, Parizel P, Van Goethem J, Altena R, Laridon A, et al. Tuberculosis of the Central Nervous System: Overview of Neuroradiological Findings.EurRadiol. 2003;13:1876–90.doi: 10.1007/s00330-002-1608-7
- Idris MN, Sokrab TE, Arbab MA, Ahmed AE, El Rasoul H, Ali S, et al. Tuberculoma of the brain: a series of 16 cases treated with anti-tuberculosis drugs. Int J Tuberc Lung Dis. 2007;11(1):91–95.
- Sanei Taheri M, Karimi MA, Haghighatkhah H, Pourghorban R, Samadian M, DelavarKasmaei H. Central Nervous System Tuberculosis: An Imaging-Focused Review of a Reemerging Disease. Radiol Res Pract. 2015;2015:1–8.doi: 10.1155/2015/202806
- Ma H, Liu Y, Zhuang C, Shen Y, Wu R. Clinical features and MRI findings of intracranial tuberculomas. Radiol Infect Dis. 2018;5(4):154–9. doi.org/10.1016/j.jrid.2018.10.001
- Sahu C, Bhargava N, Singh V, Dwivedi P. Giant tuberculomas of brain: Rare neoplastic mimic. J PediatrNeurosci. 2020;15(3):204.doi: 10.4103/jpn.JPN_78_19
- Wasay M, Farooq S, Khowaja ZA, Bawa ZA, Ali SM, Awan S, et al. Cerebral infarction and tuberculoma in central nervous system tuberculosis: frequency and prognostic implications. J NeurolNeurosurg Psychiatry. 2014;85(11):1260–4. doi: 10.1136/jnnp-2013-307178
- Saleh SS, Arshad A, Surjith V, Tarek B. Magnetic resonance imaging diagnostic features of giant intracranial tuberculoma. Int J Case Rep Images. 2019;10(2):1.doi:10.5348/101077Z01SS2019CR
- Ramachandran R, Muniyandi M, Iyer V, Sripriya T, Priya B, Govindarajan TG. Dilemmas in the diagnosis and treatment of intracranial tuberculomas. J Neurol Sci. 2017;381:256–64.doi: 10.1016/j.jns.2017.08.3258
- Parry AH, Wani AH, Shaheen FA, Wani AA, Feroz I, Ilyas M. Evaluation of intracranial tuberculomas using diffusion-weighted imaging (DWI), magnetic resonance spectroscopy (MRS) and susceptibility weighted imaging (SWI). Br J Radiol. 2018;91(1091):20180342.doi: 10.1259/bjr.20180342
- Trivedi R, Saksena S, Gupta RK. Magnetic resonance imaging in central nervous system tuberculosis. Indian J Radiol Imaging. 2009;19(4):256–65.doi: 10.4103/0971-3026.57205
- Patkar D, Narang J, Yanamandala R, Lawande M, Shah GV. Central Nervous System Tuberculosis: Pathophysiology and Imaging Findings. Neuroimaging Clin N Am. 2012;22(4):677–705.doi: 10.1016/j.nic.2012.05.006
- Isabel BE, Rogelio HP. Pathogenesis and Immune Response in Tuberculous Meningitis. Malays J Med Sci MJMS. 2014;21(1):4–10.
- Muzumdar D, Vedantam R, Chandrashekhar D. Tuberculosis of the central nervous system in children. Childs Nerv Syst. 2018;34(10):1925–35. doi: 10.1007/s00381-018-3884-9
- Bayındır C, Mete O, Bilgic B. Retrospective study of 23 pathologically proven cases of central nervous system tuberculomas. Clin NeurolNeurosurg. 2006;108(4):353–7. doi: 10.1016/j.clineuro.2005.03.001
- Bouali S, Bahri K, Zehani A, Ghedira K, Abderrahmen K, Kallel J. Giant posterior fossa tuberculoma in immunocompetent adults. Hum Pathol Case Rep. 2020;19:200342.doi.org/10.1016/j.ehpc.2019.200342
- Sumer S, Koktekir E, Aktug Demir N, Akdemir G. Intracranial giant tuberculoma mimicking brain tumor: a case report. Turk Neurosurg. 2015;25(2):337–9.doi: 10.5137/1019-5149.JTN.9998-13.1
- Bhattacharyya A, Boruah DK, Handique A, Singh V, Kalita J, Misra UK, et al. Involvement of the Choroid Plexus in Neurotuberculosis: MR Findings in Six Cases. Neuroradiol J. 2010;23(5):590–5.doi:10.1177/197140091002300507
- Agrawal P, Phuyal S, Panth R, Shrestha P, Lamsal R. Giant Cerebral Tuberculoma Masquerading as Malignant Brain Tumor – A Report of Two Cases. Cureus. 2020Sep 20;12(9):e10546.doi: 10.7759/cureus.10546
- Prasad R, Rai A, Singh A, Mishra OP, Singh UK. Giant Tuberculoma Masquedering as Brain Tumor.Clin Neurol Int. 2020;2(1):1013.
- Parihar V, Yadav Y, Sharma D. Giant extra-axial posterior fossa tuberculoma in a three-year-old child. Neurol India. 2009;57(2):218–20.doi: 10.4103/0028-3886.51304
- Pretell EJ, Martinot CJ, Garcia HH, Alvarado M, Bustos JA, Martinot C, et al. Differential Diagnosis Between Cerebral Tuberculosis and Neurocysticercosis by Magnetic Resonance Spectroscopy. J Comput Assist Tomogr. 2005;29(1):112–114. doi: 10.1097/01.rct.0000149959.63294.8f
- Pandit S, Lin A, Gahbauer H, Libertin CR, Erdogan B. MR spectroscopy in neurocysticercosis. J Comput Assist Tomogr. 2001;25(6):950–2.doi: 10.1097/00004728-200111000-00019
- Satyarthee GD. Giant Intracerebral Tuberculoma with Complete Disappearance on Antitubercular Therapy Alone in a Pediatric Case: A Case Illustration with Review of Management Strategy.J PediatrNeurosci. 2017 Apr-Jun;12(2):180–184.doi: 10.4103/jpn.JPN_173_16
- Binesh F,Zahir ST,Bovanlu TR. Isolated cerebellar tuberculoma mimicking posterior cranial fossa tumor.BMJ Case Rep. 2013;2013:bcr2013009965.doi: 10.1136/bcr-2013-009965
- Akhaddar A, Boucetta M. Giant brain tuberculoma mimicking a malignant tumor in a child. Pan African Medical Journal. 2014;17(112):112.doi: 10.11604/pamj.2014.17.112.3941
- Raheja A, Sinha S, Sable MN, Sharma MC, Sharma BS. A case of giant intracranial tuberculoma in an infant: Clinical and radiologic pitfalls. J Child Neurol. 2015;30:364–7.doi: 10.1177/0883073814535487
- Chatterjee S, Saini J, Kesavadas C, Arvinda HR, Jolappara M, Gupta AK. Differentiation of tubercular infection and metastasis presenting as ring enhancing lesion by diffusion and perfusion magnetic resonance imaging. J Neuroradiol. 2010;37:167–71.doi: 10.1016/j.neurad.2009.08.005
- Poptani H, Gupta RK, Roy R, Pandey R, Jain VK, Chhabra DK. Characterization of intracranial mass lesions with in vivo proton MR spectroscopy. AJNR Am J Neuroradiol. 1995;16:1593–603.